Oil Price Forecast
 Oil Price Forecast
Worldwide Uncertainty and Investing in Oil
With the stalled economic recovery, the prolonging Russo-Ukrainian war, and the ongoing negotiations with Venezuela, Iran, and Saudi Arabia, the only certainty is that we live in times of uncertainty. With my empirical analysis based on this assumption, I argue that the optimal investment strategy for the upcoming 6-12 months is to short oil.
In times of peace and prosperity, following trends is the best method of investing in oil. This is because factors that determine oil price and changes in oil price are easy to follow and predict, and the trend reflects these straightforward predictions. In fact, research has shown that even the best performing models have little to no advantage over simply following the market trend.1
In times of risk and uncertainty, however, the factors that determine oil price are more volatile. The determinants of oil price shift by more, more often, and more rapidly. Thus, most investors in the market cannot predict oil prices well, and current trends give no clue.
Investors equipped with carefully developed statistical models may turn times of uncertainty and risk into times of opportunity and return. The statistical models are trained on historical data on oil price and its predictors. Thus, they can capture large and rapid changes in oil price predictors and translate them into the most likely outcomes.
To craft my medium view on oil, I built my model to satisfy these three criteria: 1) designed for the times of uncertainty; 2) proven to work well over the horizon of 6-12 months, 3) easy to interpret. Leading economic research has shown that the Vector Autoregressive (VAR) model outperforms other oil price forecasting models in times of uncertainty and in the medium term.2 This method is conceptually simple, and the results easy to understand.
What the Data Tell Us
Data from federal agencies3 indicate that a decrease in Brent oil prices is predicted 6-12 months ahead by a decrease in global real economic activity, an increase in interest rate, and the appreciation of dollar with respect to the currencies of oil-producing countries, and (somewhat counterintuitively)4 a decrease in oil production.
Over the past nine months, interest rates have been increasing, dollar has been appreciating, and oil production has been increasing. These forces put a downward pressure on oil prices. However, real economic activity was fluctuating and started increasing in January, which may put an upward pressure on oil prices.
My Recommendations
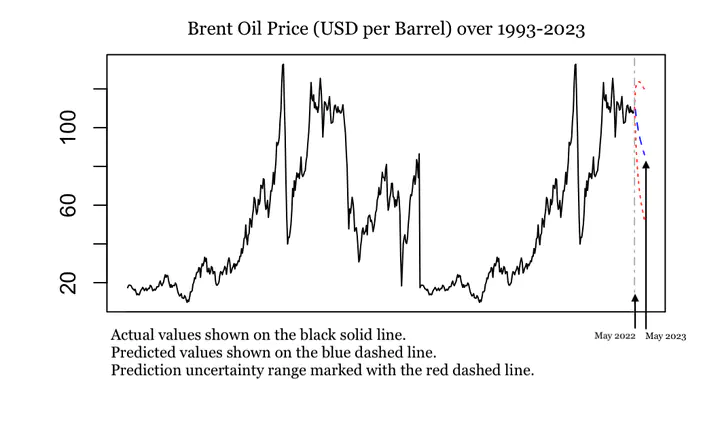
We do not know which of these factors have the largest impact in our investment period. However, my model is trained to figure this out. It looks at the price and the factors at different points in the past and comes up with the best formula. Then it translates the changes in recent months to predictions about the prices of oil in the upcoming months. According to my model, it is more likely than not that oil prices will be going down over the next 6-12 months into the future. (See the figure below.)
I would execute the trade by an indirect exposure method: short selling an ETF of stocks of companies in the oil industry such as the PXE. Compared to futures, options, and commodities funds, this choice is less sensitive to oil price fluctuations. It also minimizes unnecessary exposure to oil as a commodity. I would close the trade when the model no longer predicts a downward trend based on new data supplied.5
References
Alquist, Ron & Kilian, Lutz & Vigfusson, Robert J., 2013. “Forecasting the Price of Oil,” Handbook of Economic Forecasting, in: G. Elliott & C. Granger & A. Timmermann (ed.), Handbook of Economic Forecasting, edition 1, volume 2, chapter 0, pages 427-507, Elsevier.
Christiane Baumeister & Lutz Kilian. 2015. “Forecasting the Real Price of Oil in a Changing World: A Forecast Combination Approach,” Journal of Business & Economic Statistics, 33:3, 338-351, DOI: 10.1080/07350015.2014.949342
Samya Beidas-Strom & Benjamin Beckers, 2015. “Forecasting the Nominal Brent Oil Price with VARs—One Model Fits All?,” IMF Working Papers 2015/251, International Monetary Fund
-
Source: Baumeister et al., 2015. In technical terms, all alternative models have the Mean Squared Prediction Error very close to that of the no-change forecasting model. ↩︎
-
Samya Beidas-Strom et al., 2015; Baumeister et al., 2015; Alquist et al., 2013. ↩︎
-
In particular, 1993-2022 monthly data retrieved from the following sources: U.S. Energy Information Administration, the Federal Reserve Bank of Dallas, the Federal Reserve Economic Data, the OECD Stat Portal, and the BP Statistical Review. ↩︎
-
According to the economic theory, an increase in supply leads to a decrease in price. However, decisions about an increases oil production may reflect increases in demand or other factors that later translate into price increases. This may explain the positive correlation. ↩︎
-
Note that I would keep using the VAR model as long as times are uncertain, i.e., the crude oil volatility index (OVX) remains above 42 points, the 75th percentile of its historical average. ↩︎